.jpeg)
Visualizing a story buried in FAA data
I’m a historical aviation nut, so when I recently looked for some public data to play with, I turned to the FAA’s database of all civilian aircraft registered in the United States. My curiosity paid off because my first foray into that data led to an interesting topic for viz on Tableau Public. This post is about how I went about discovering and visualizing the story in Tableau. I also went down a few interesting side paths, which I will delve into in later posts.
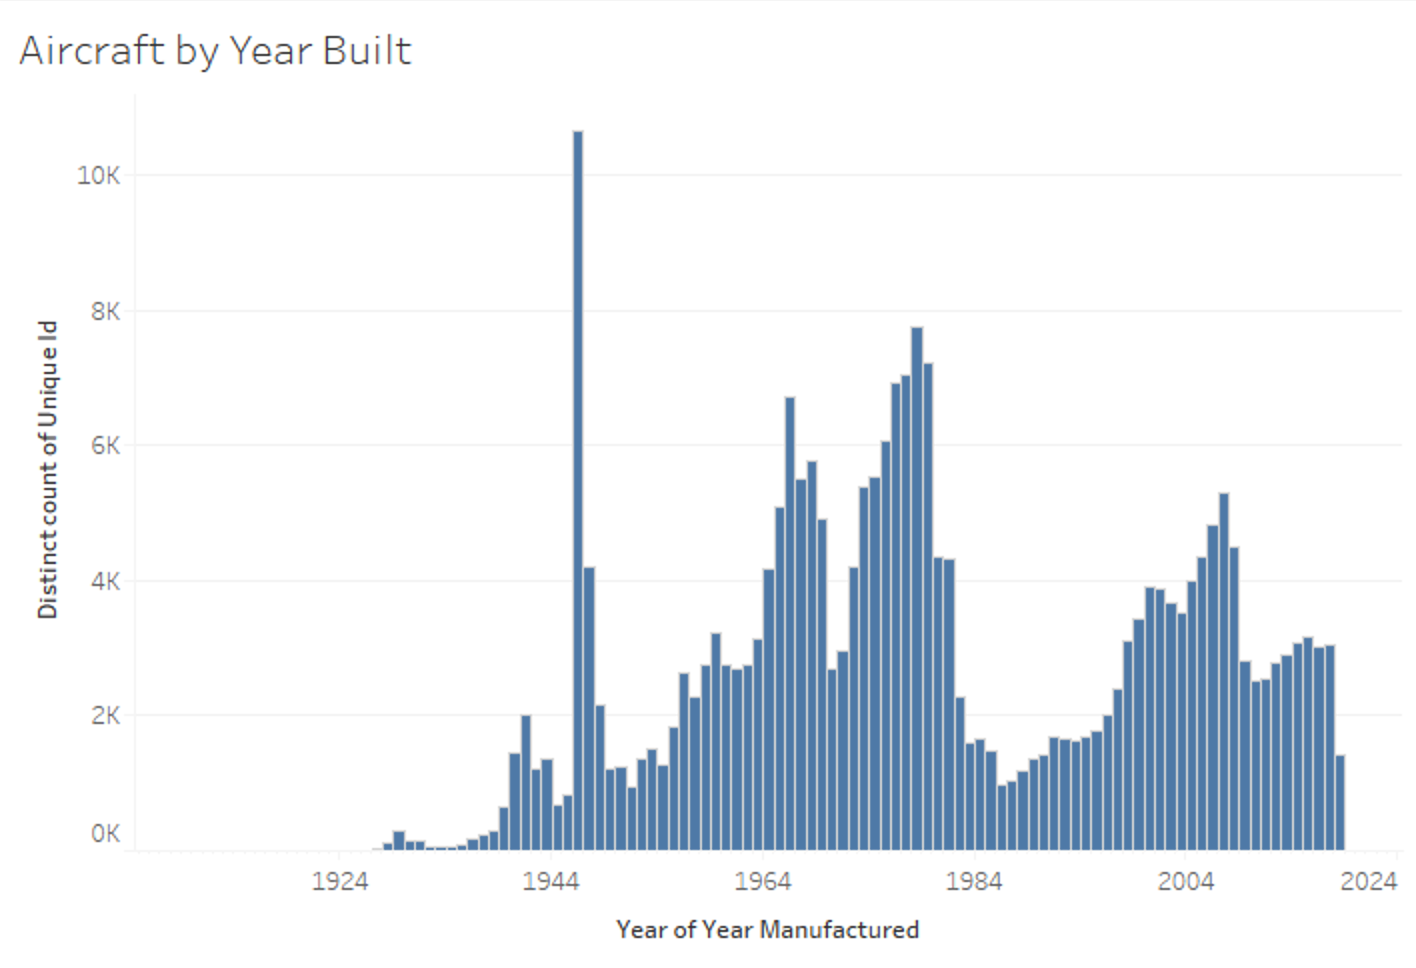
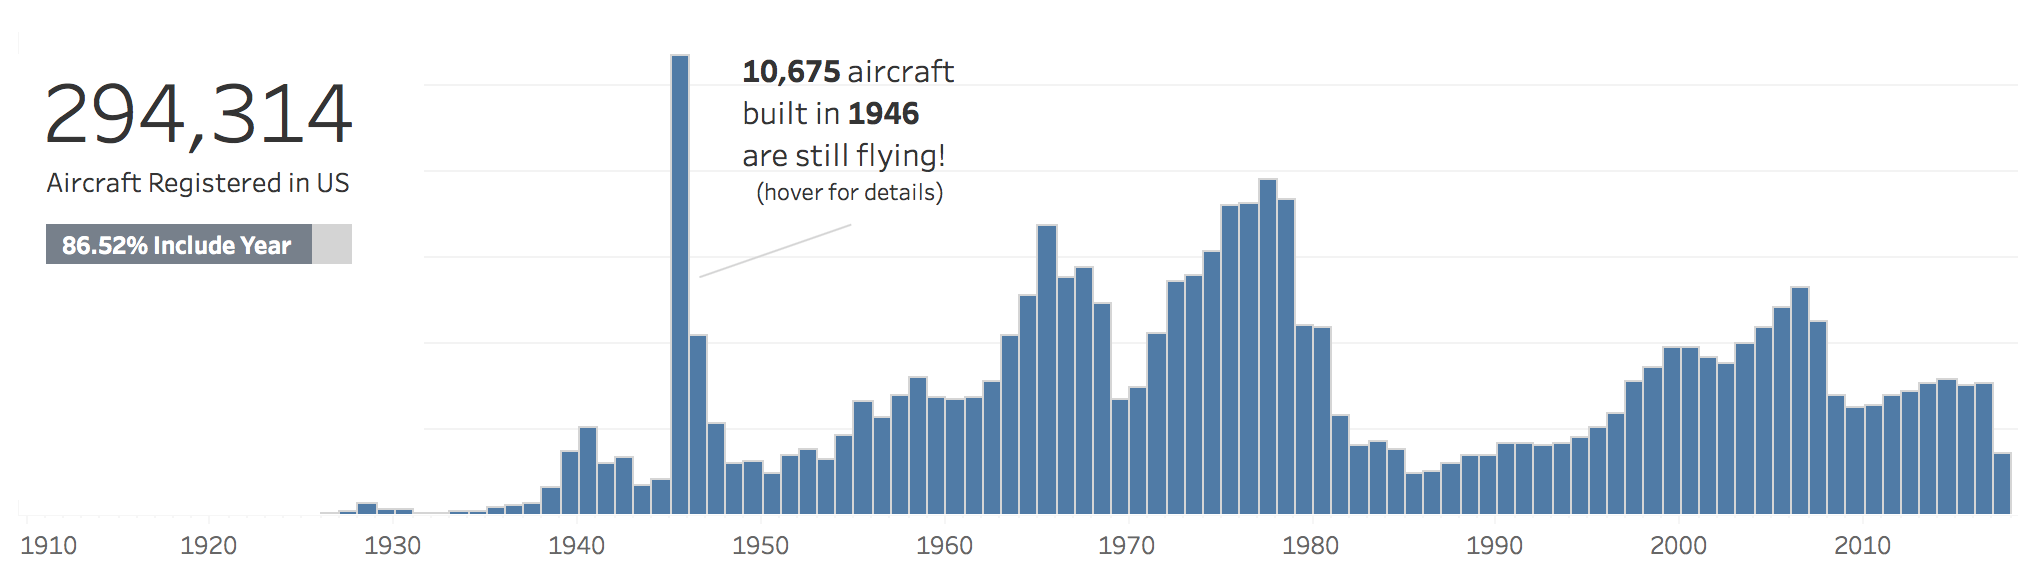
The FAA data is available as a set of CSVs with a PDF document describing each table and column, so it’s very easy to start exploring it in Tableau. As a first step, I just pulled the MASTER table into Tableau and started looking at the columns available. Since I’m particularly interested in historical aircraft, I quickly zeroed in on the YEAR MFR column. Dragging this out to create a basic bar chart, I immediately saw something interesting. A huge spike in 1946!
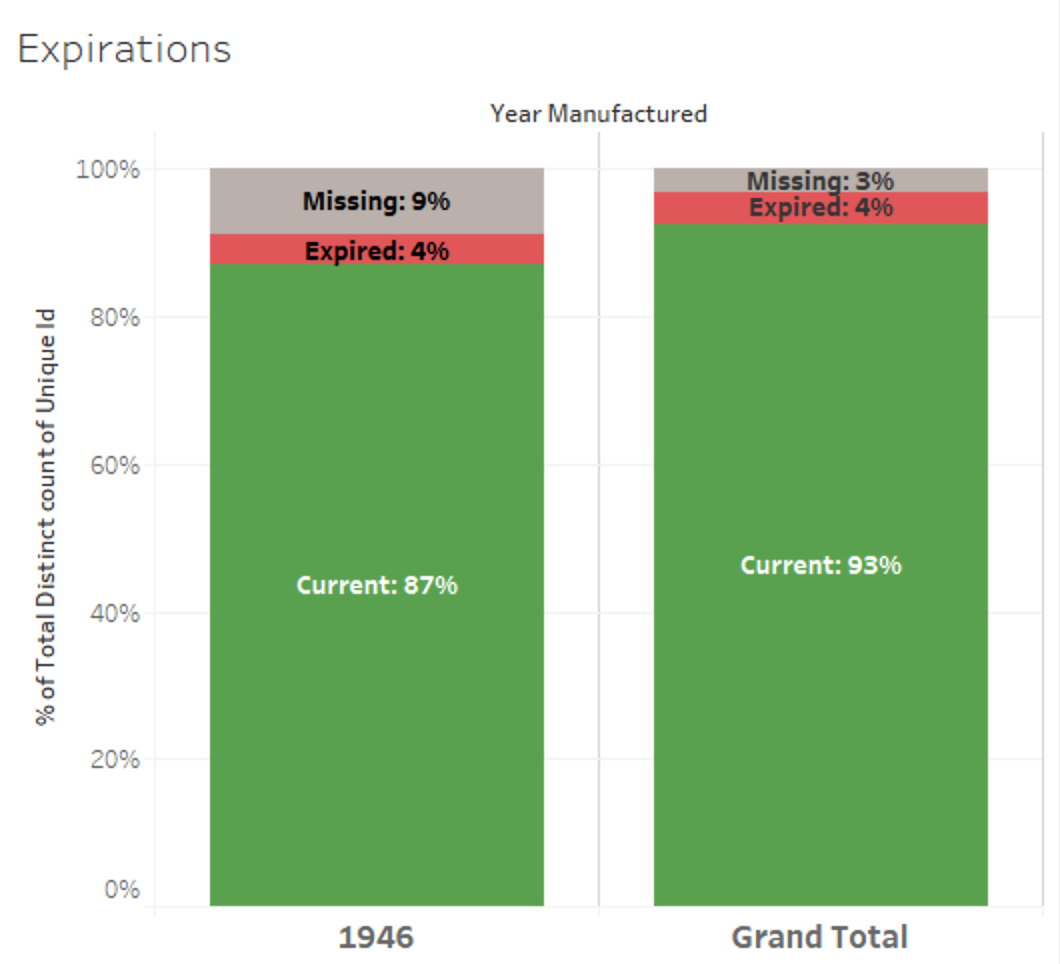
Could this be correct? I wondered if maybe this was some default value. Or maybe old records that are still present in the database? So I looked at CERT ISSUE DATE and EXPIRATION DATE. The FAA requires all civilian aircraft in the US to be registered, and for registration to be renewed every three years. Overall, 93% of the aircraft in the database have unexpired certifications, as do 87% of those manufactured in 1946. So these aircraft owners are clearly making an effort to keep current with the FAA.
The year of this spike was right after World War II, so did this reflect military aircraft that were converted to civilian use? A quick way to validate this would be to look at aircraft type. To do this, I needed to join the ARFTREF table, which the data dictionary told me was related by a seven-digit compound Manufacturer/Model/Series code. Once I joined ARFTREF to MASTER, I could look at the top Manufacturers and Models of aircraft built in 1946.
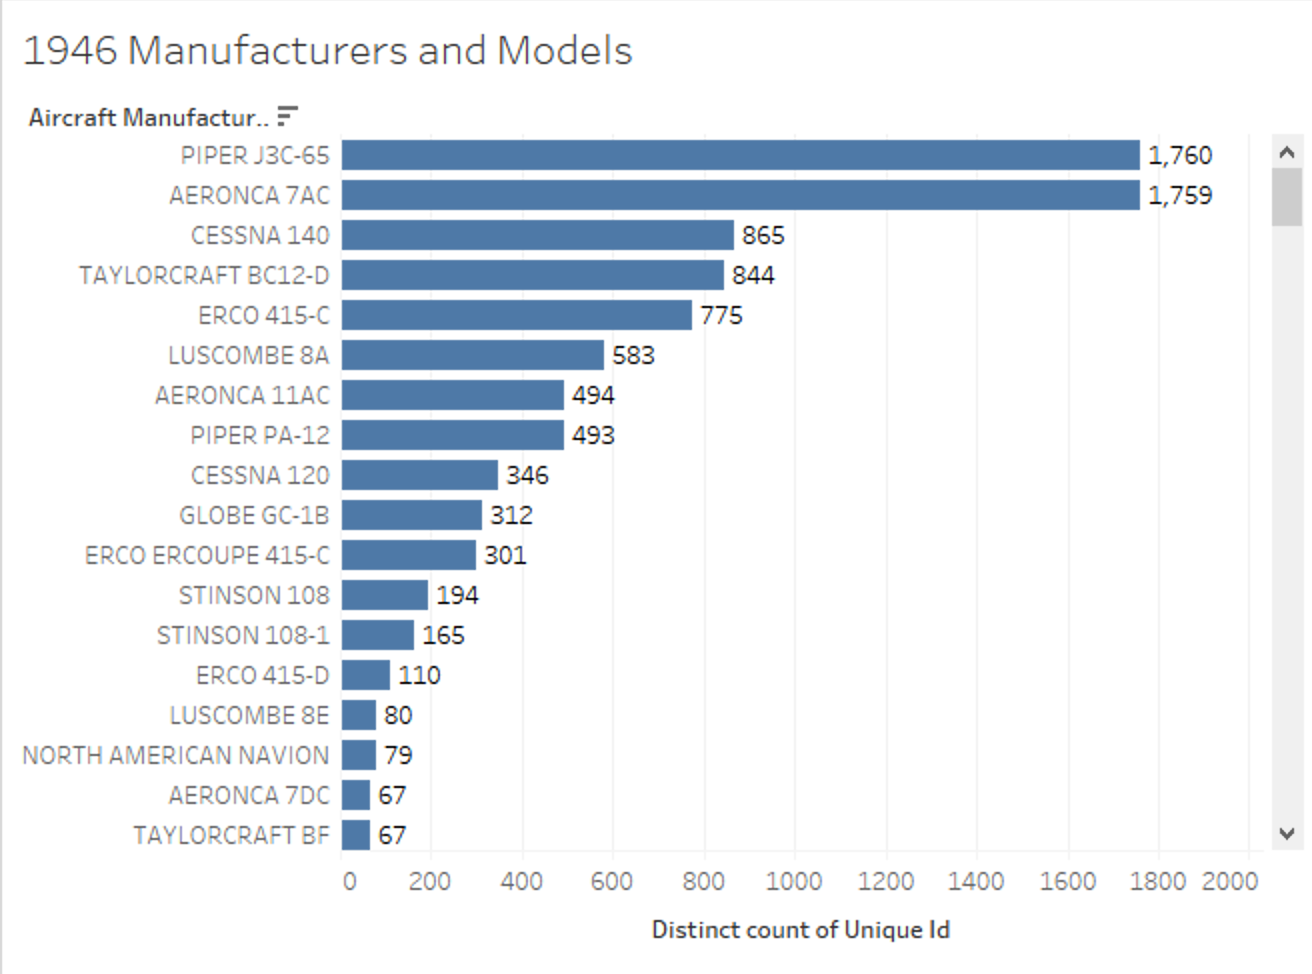
Sure enough, these all looked like mid-20th century aircraft. But they didn’t appear to be converted military aircraft. Doing a little research on Wikipedia, I realized that there was indeed a connection to the ending of WWII: Much of the aircraft manufacturing capacity developed during the war was convert to civilian use, and a large number of military pilots left the military with flying skills, triggering a boom in private civilian aviation.
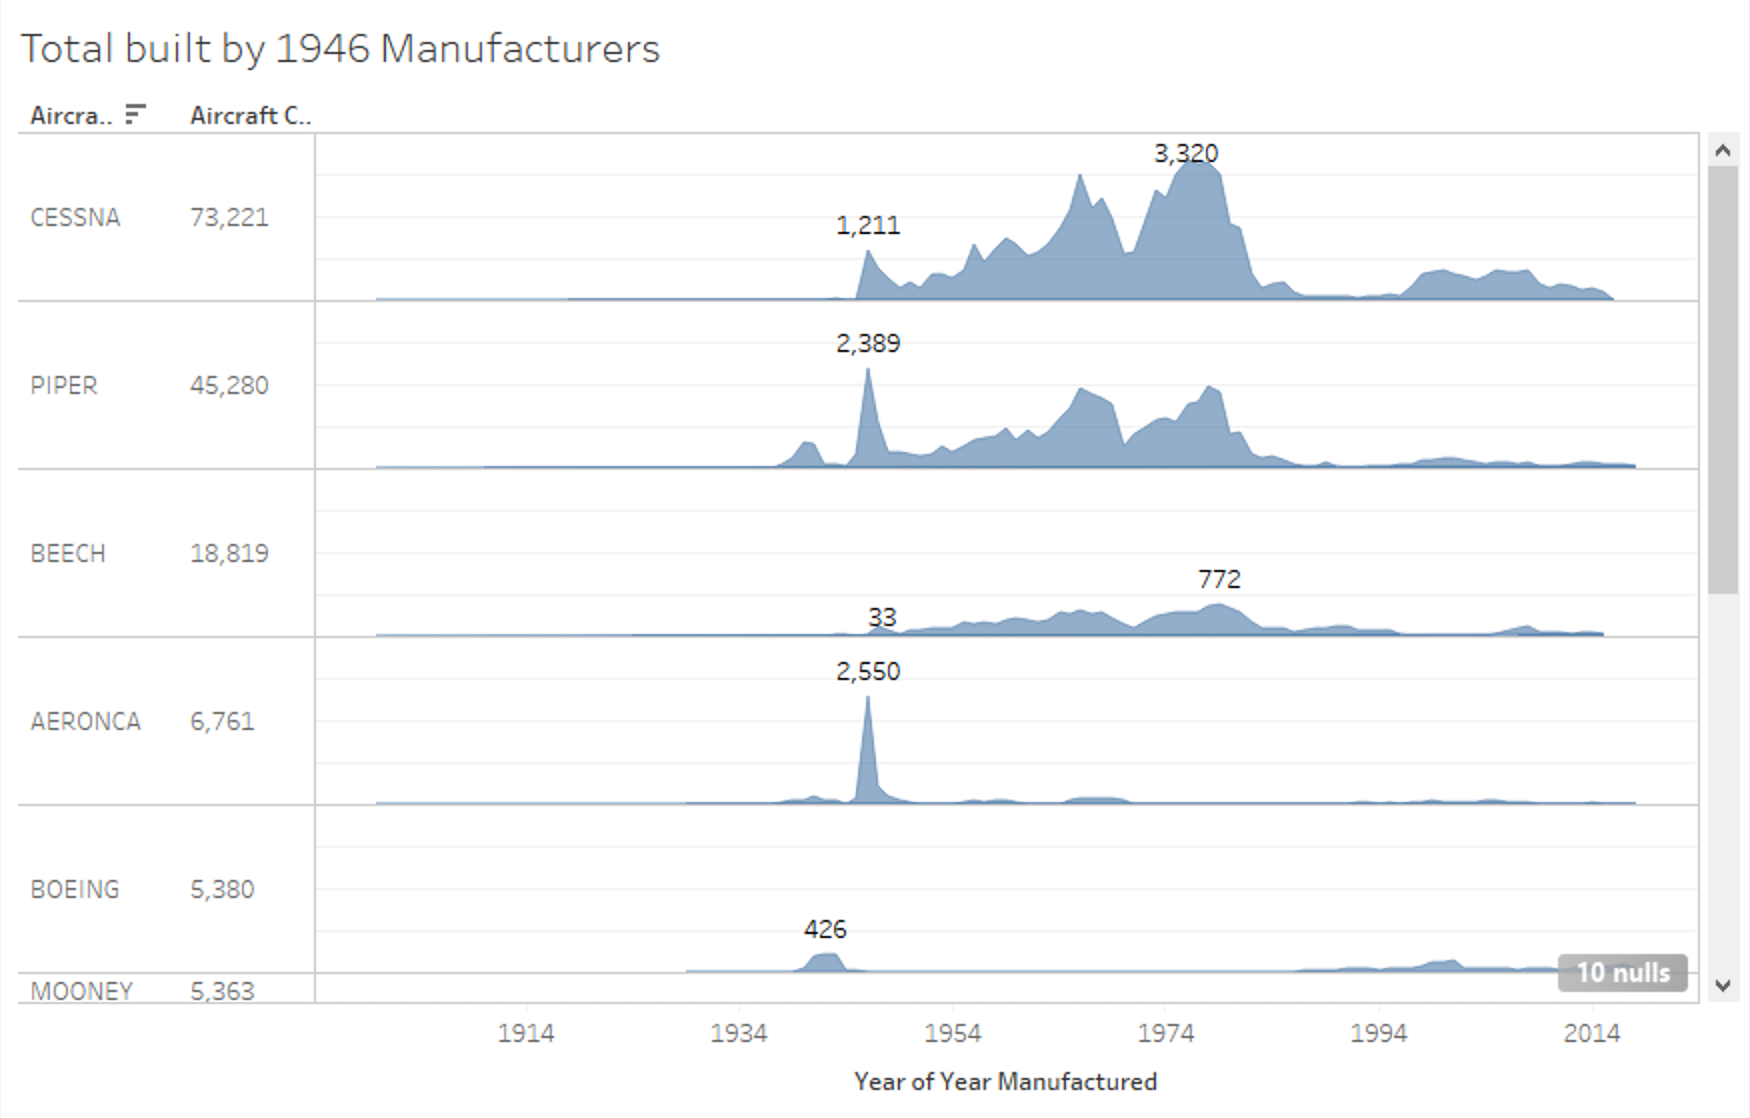
Looking at the top manufacturers, I noticed some familiar names like Piper and Cessna, but also some less familiar names. I decided to look the total numbers for all years for each top 1946 manufacturer and noticed something else interesting: Cessna, while synonymous with private aviation, was not the top manufacturer in 1946, but went on to build far more aircraft that the others.
I did a quick reality check of these numbers against Wikipedia:
- In 2010, Piper claimed to have built 144,000 aircraft, 90,000 of which were still flying. That’s a worldwide figure, so 47,000 still flying in US in 2018 seems plausible.
- In 1975, Cessna reported building its 100,000th single-engine plane. If their still-flying ratio were the same as Piper’s, that would mean 63,000 still flying in 1975. The FAA data includes 65,000 single-engine Cessnas currently registered, which seems like a plausible figure after 38 more years of production and retirement.
I felt that these two observations were the beginning of an interesting story to tell, particularly because this wasn’t just data about aircraft built per year, but aircraft that are still registered to fly. How durable these old aircraft must be!
So how best to visualize this? My first step was to decide on the main beats of the story that I wanted to tell. I decided on three:
- Of all the aircraft currently registered to fly in the US, a huge number were built in one year more than 60 years ago.
- Who were the companies behind these durable machines?
- Which aircraft models have been the most enduring?
Next I thought about how to lay out this story on the page. I wanted it all in one view, so that it would be easy to take in the scope of the entire story at a glance, and so that it could even hold up as a static image. So I opted for a simple stacked top-to-bottom flow that would lead the viewer’s eyes down the page with a combination of visuals and captions.
Then I turned my attention to how to render each story point. For the first point, I felt that the simple bar chart that led to my discovery was still the most effective visualization. The magnitude of the 1946 spike sells itself. I sought to emphasize this point by minimizing distractions and “non-data ink” like grid lines and axis labels. And instead of showing a vertical axis or labeling each data point, I just called out the total for 1946. The exact numbers for the other years is less important their their relative size compared with 1946.
I also wanted to convey the size of the source data, and acknowledge that a certain percentage includes no year of manufacture. I felt this was best shown with a single “big number” underlined by a 100% stacked bar.
For the second story point, I wanted to draw the viewer into more detail about the top manufacturers of 1946 and how their later trajectories differed. I felt that simple line charts would be the most effective way to convey the overall shape of each manufacturer over time. It would also offer a bit of contrast with the bars in the first chart, and would let me align the time axes of the first two story points. Once again, I minimized “non-data ink” by removing axes and labeling only the 1946 numbers and the overall total for each manufacturer. Of the 48 different manufacturers in 1946, the top 5 represented about 80% of the aircraft built, so I grouped the other ~20% under “Other.”

I also wanted to add some interactivity to both charts, but in a way that supplemented the main story without making the story dependent on it. So I added a hover-tooltip that used Tableau’s recent viz-in-tooltip feature showing one level of detail deeper. I also included the total count in the tooltip to further eliminated the need for a y-axis.
For the third story point, I knew I wanted to incorporate some aircraft photos somehow. Because what’s cooler than photos of old airplanes? Rather than trying to cram in several photos at once, I envisioned a sort of slideshow tied to a chart of the top 10 models. I played with a few possible layouts before arriving at the final arrangement. I felt that a side-by-side layout would support a natural left-to-right flow and add some visual variety after the first two charts. A final touch was flipping the bars to be right-aligned so they would act as navigation tabs for the slideshow. Getting this to work in Tableau was quite a challenge, but that’s a story for another blog post.
With the main charts done, I applied some finishing touches. For color scheme, I stuck with the default Tableau blue. Color should always be used very purposefully, and I felt that this viz didn’t really need any color variation to tell its story. Last but not least, I wanted a good headline. I came up with “They sure knew how to build ’em in ’46” to focus on amazing durability of these aircraft, with the sort of folksy phrasing that you could hear coming from the mouth of a old aviator.
Here’s a screenshot of the final viz:

One note on performance tuning: When I initially built the top 1946 manufacturer line charts, I found a lot of spelling variations in manufacturer names. For example, there were 15 different variations of “Cessna” and 40 different variations of “Piper.” So I started by building a grouped field to collapse those together, as well as all the remaining manufacturers that I wanted to combine into “Other.” However, once I published to Tableau Public, the performance of the embedded Top 10 Models per year viz in tooltip was abysmally slow — like 30-60 seconds to filter by manufacturer name and year, then select the top 10. Going back to the data, I realized that the seven-digit Manufacturer/Model/Series code contained a 3 digit Manufacturer code that was usually the same across all these spelling variations. Once I switched to using a numeric field rather than grouped text field for this filtering, performance improved tremendously.
I hope you enjoy the viz and reading about how I built it. Stay tuned for some deep dives on data and photo wrangling.